@TDAM_Canada
Investor Knowledge + 10 Minutes = Current Insights
The U.S. stock market has become more top-heavy than at any point in the last half-century. Today, just 10 stocks make up roughly 36% of the S&P 500's total weight.[1] On the surface, this concentration has been a tailwind for investors. The strong performance of a few mega-cap names (particularly in technology) has helped lift overall market returns and made it easier for passive investors to gain exposure to broad equity markets through index funds. But beneath that simplicity lies an increasingly fragile structure.
Why Concentration Is a Problem
When a handful of stocks drive most of the gains, markets become more susceptible to company-specific risks. A downturn in just one or two of these dominant names can ripple through the entire S&P 500 index, masking the performance of the other 490 companies and skewing perceptions of overall market health. This dynamic may leave investors exposed to a false sense of diversification, when in reality their portfolios hinge heavily on the fate of a few firms.
This pattern isn't new. In every decade, certain sectors or companies have risen to dominance, only to eventually lose their footing. In the 1970s and 1980s, the top of the S&P 500 was filled with industrial and energy giants like IBM and ExxonMobil. By the late 1990s, the baton had been passed to technology stocks, culminating in the dot-com bubble. The 2000s saw value stocks and financials rise, only to be undone by the 2008 financial crisis. Now, once again, there is a surge in concentration. This time it's led by the Magnificent 7 (which include Alphabet, Microsoft, Apple, Amazon, NVIDIA, Tesla and Meta Platforms) and the broader tech sector, with the same warning signs flashing.
Figure 1: Top 10 Largest Stocks in the S&P 500
1985 | 1990 | 1999 | |||
International Business Machines Corporation | 6.1% | 国际商业机器公司(International Business Machines Corp) | 2.9% | Microsoft Corp. | 4.2% |
Exxon Corporation | 2.4% | General Electric Co. | 2.8% | General Electric Co. | 3.3% |
GE Aerospace | 2.2% | Exxon Mobil Corp. | 2.5% | International Business Machines Corp. | 2.2% |
American Telephone and Telegraph Company | 1.8% | Altria Group Inc. | 1.9% | Nokia of America Corp. | 2.0% |
General Motors Corporation | 1.4% | Royal Dutch Petroleum Co. | 1.8% | Intel Corp. | 2.0% |
Bristol-Myers Co. | 1.2% | AT&T Corp. | 1.7% | Walmart Inc. | 1.9% |
Royal Dutch Petroleum Co. ADR | 1.1% | Merck & Co Inc. | 1.5% | Cisco Systems Inc. | 1.8% |
Amoco Corporation | 1.1% | Bristol-Myers Squibb Co. | 1.4% | Exxon Mobil Corp. | 1.7% |
E. I. du Pont de Nemours and Company | 1.1% | Procter & Gamble Co./The | 1.3% | AT&T Corp. | 1.6% |
BellSouth Corporation | 1.1% | Coca-Cola Co./The | 1.3% | Merck & Co Inc. | 1.5% |
2009 | 2019 | 2025 | |||
Exxon Mobil Corp. | 4.1% | Microsoft Corp. | 4.3% | NVIDIA Corp. | 7.3% |
Microsoft Corp. | 2.2% | Apple Inc. | 3.5% | Microsoft Corp. | 7.0% |
强生公司 | 2.0% | Amazon.com Inc. | 3.3% | Apple Inc. | 5.8% |
Procter & Gamble Co. | 2.0% | Meta Platforms Inc. | 2.0% | Amazon.com Inc. | 3.9% |
AT&T Corp. | 1.7% | Berkshire Hathaway Inc. | 1.7% | Meta Platforms Inc. | 3.1% |
International Business Machines Corp. | 1.7% | JPMorgan Chase & Co. | 1.5% | Broadcom Inc. | 2.5% |
JP Morgan Chase & Co. | 1.7% | 强生公司 | 1.4% | Alphabet Inc. Class A Shares | 2.0% |
Apple Inc. | 1.6% | Alphabet Inc. Class A Shares | 1.4% | Berkshire Hathaway Inc. | 1.7% |
Chevron Corp. | 1.6% | Alphabet Inc. Class C Shares | 1.4% | Tesla Inc. | 1.7% |
General Electric Co. | 1.6% | Exxon Mobil Corp. | 1.3% | Alphabet Inc. Class C Shares | 1.6% |
Source: Bloomberg Finance L.P., Factset, TD Asset Management Inc. (TDAM). As of December 31 for 1985 - 2019. As of June 30 for 2025.
What makes the current environment particularly notable is the severity of the concentration. One way to measure this is through the Herfindahl-Hirschman Index (HHI), which reflects how many stocks meaningfully contribute to index performance. From 2010 to 2016, both U.S. and global indices had effective concentration rates between 25-30% (see figure 2). Today, global markets have become more diversified, but the S&P 500 has gone in the opposite direction. Its effective contributor count has dropped to just under 10%, a 15-year low (see figure 2), illustrating how dependent the index has become on a small group of stocks.
Figure 2: Percentage of Effective Members of the Index
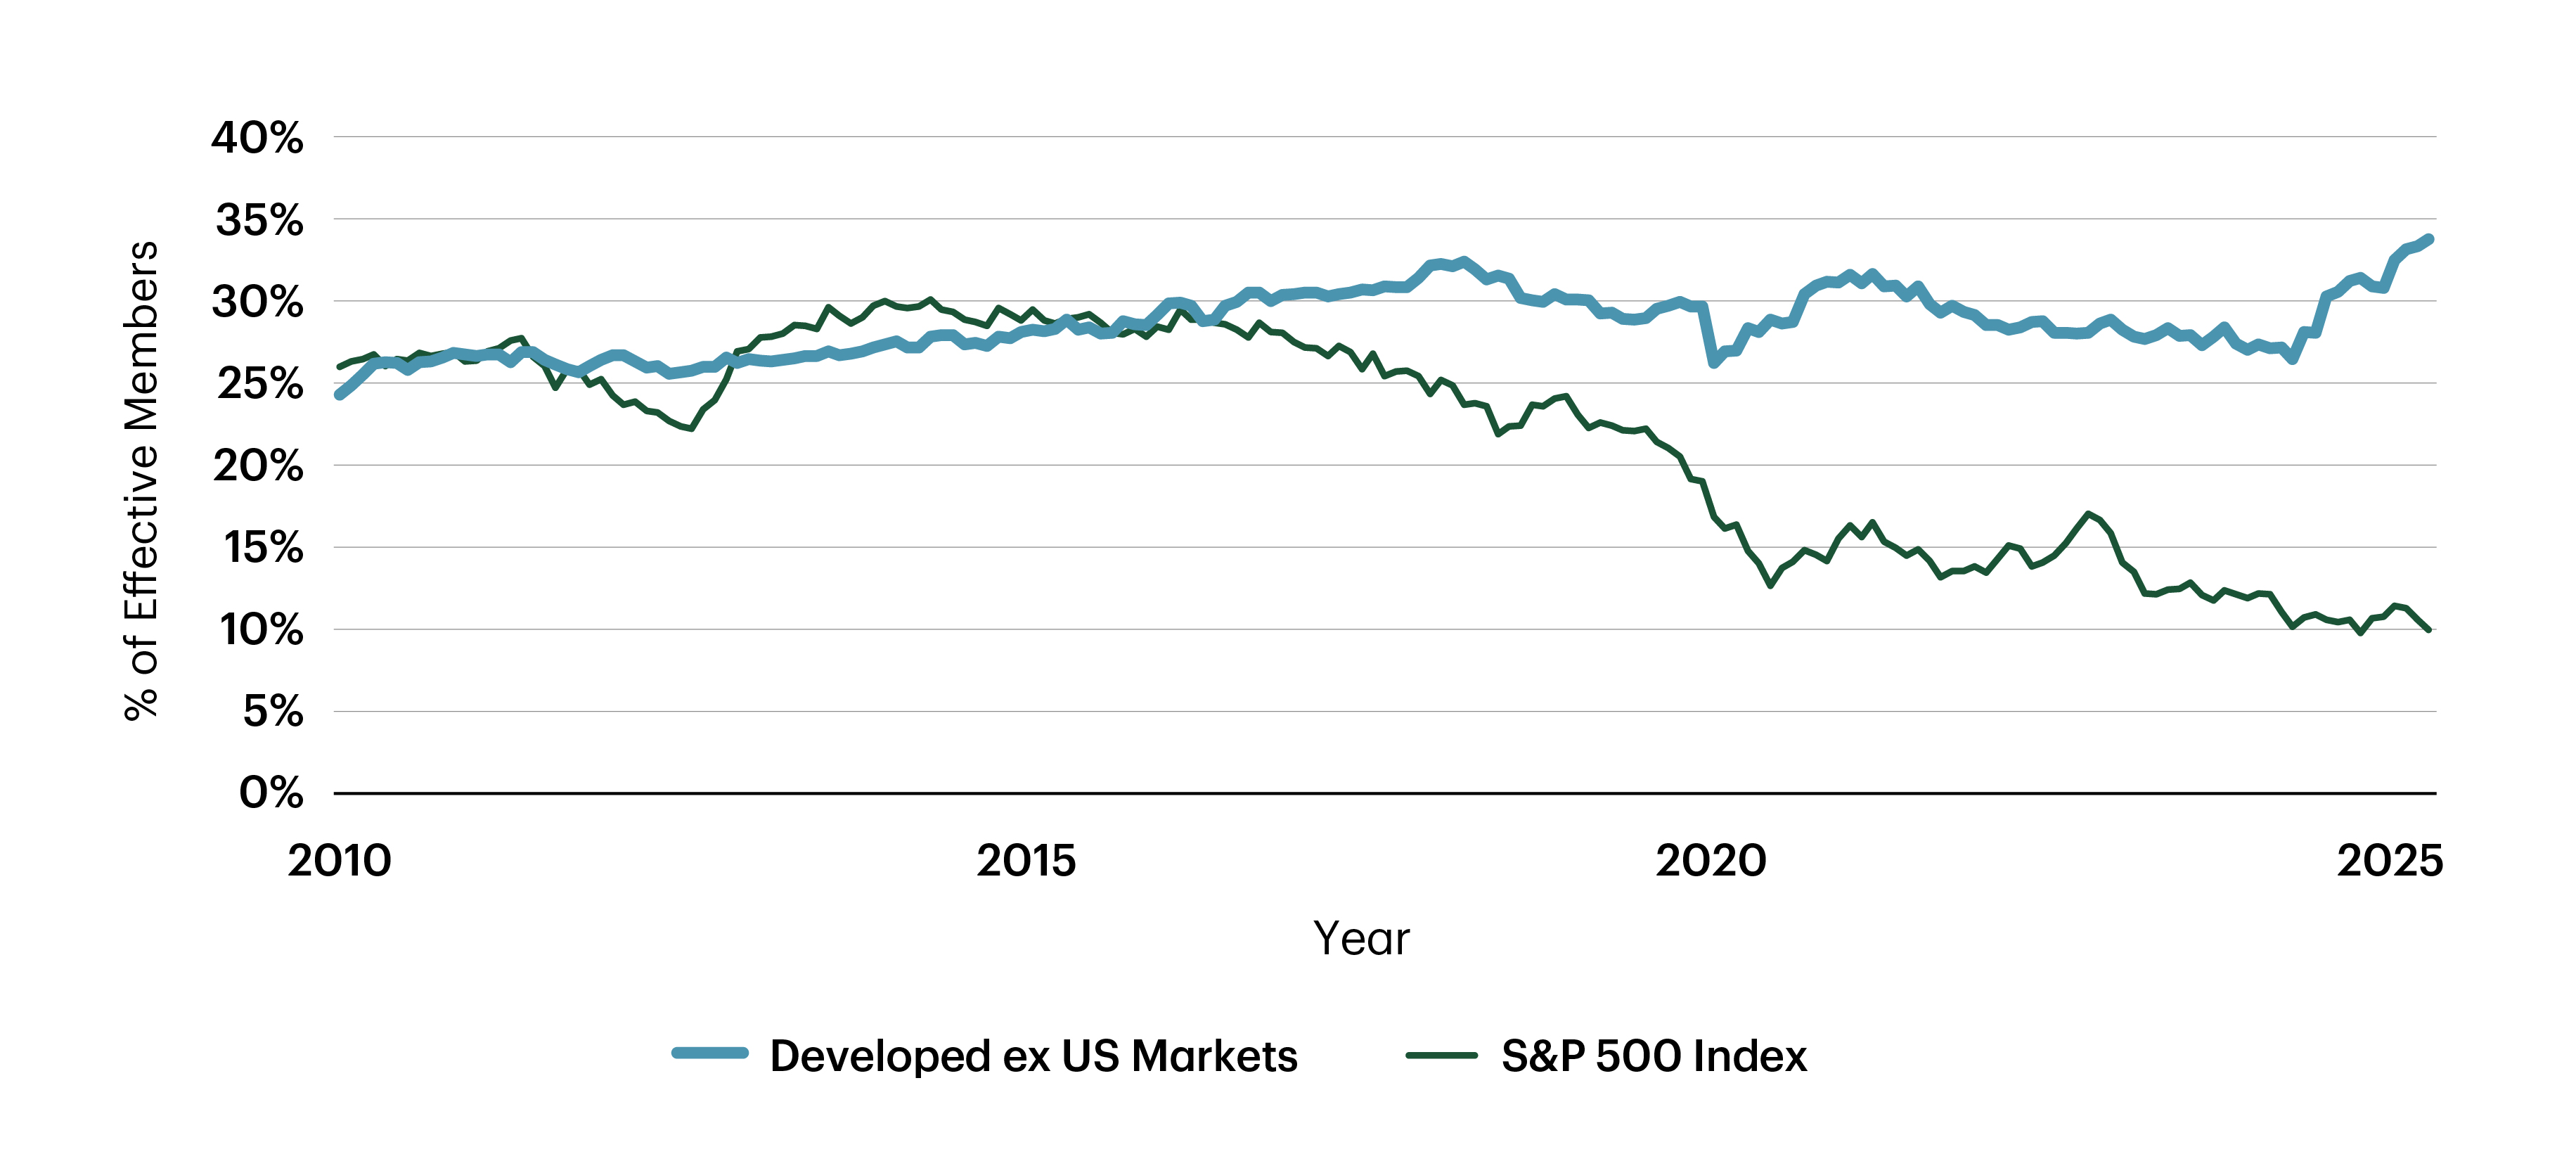
来源:Bloomberg Finance L.P.,道明资产管理有限公司。截至2025年6月30日。
This growing concentration also shows up in risk metrics. The top 10 S&P 500 stocks now account for nearly half of the total volatility in the index (see figure 3). This level of risk concentration is increasingly disproportionate to the number of companies investors assume they're exposed to when buying into a broad index fund.
Figure 3: Weight and Risk Contribution of Top 10 Stocks – S&P 500
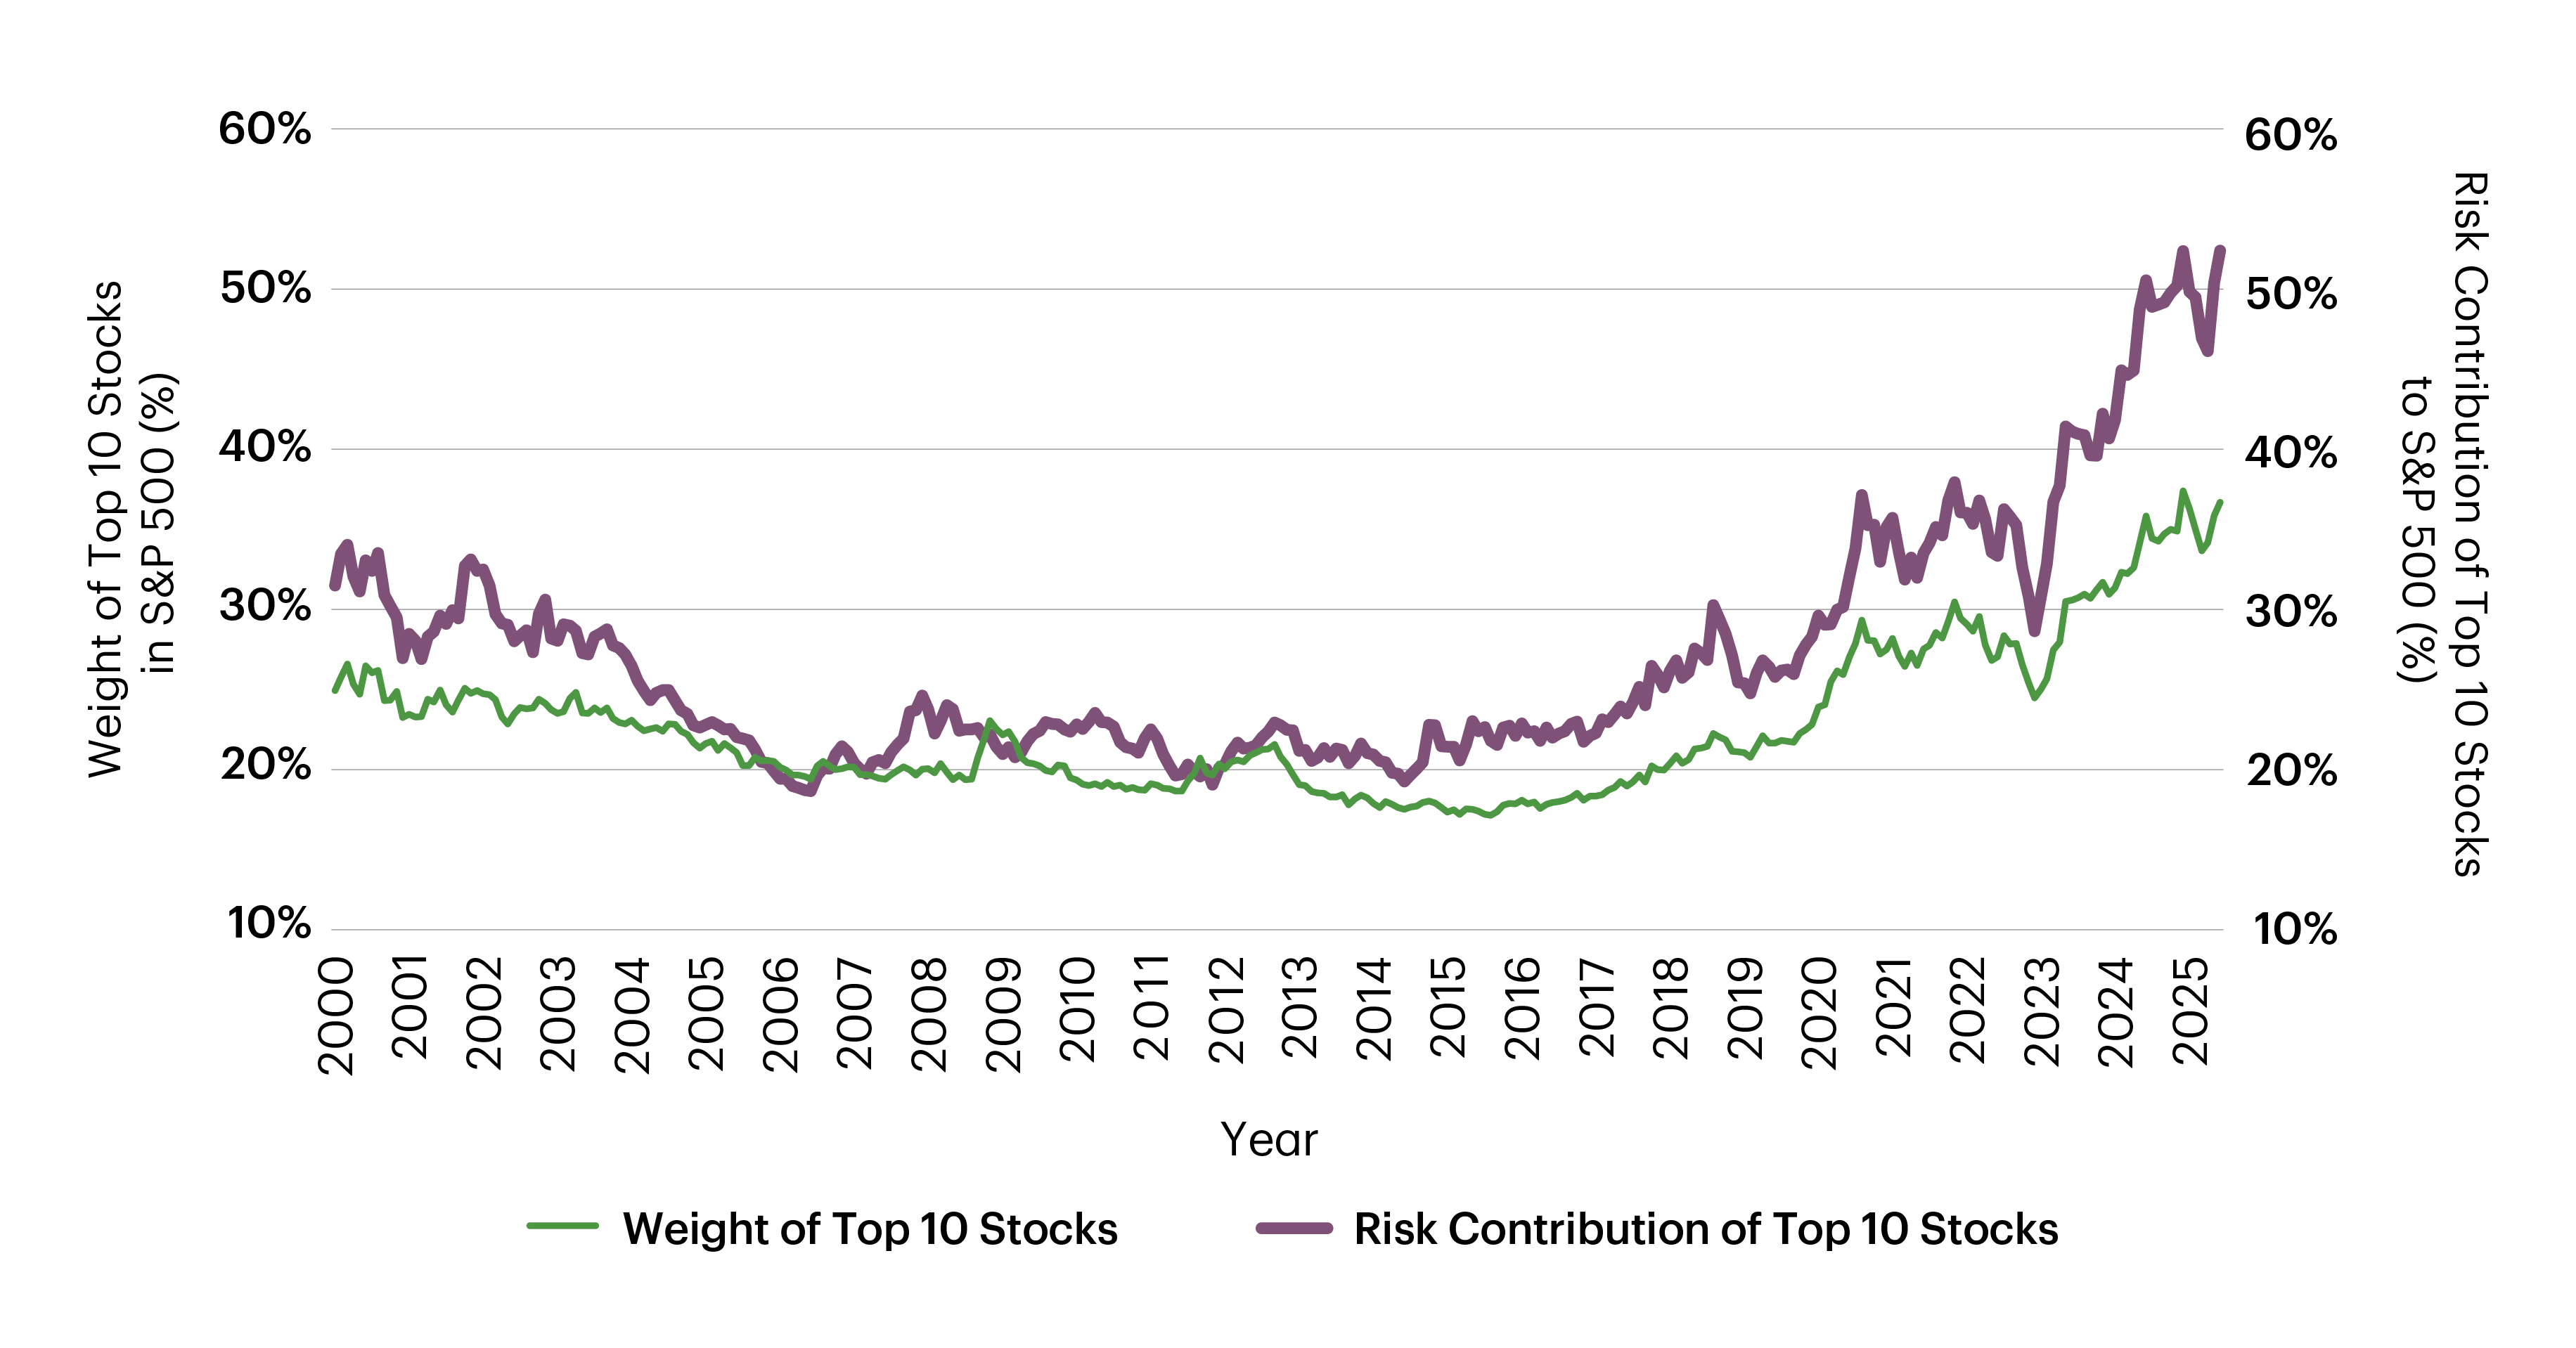 Source: TDAM, S&P Global Inc. As of June 30, 2025.
Meanwhile, investors are already contending with a series of powerful headwinds: tariffs, geopolitical conflict in the Middle East, volatile energy prices, a surging U.S. fiscal deficit, and a weakening U.S. dollar. Any of these risks could be the tipping point that breaks the momentum behind today's most crowded markets. In such an environment, a highly concentrated portfolio may be particularly vulnerable. That's why staying diversified, not just by name count but by risk exposure, is more important than ever.
How Low Vol May Help Manage Concentration
One approach that may offer a measure of resilience is low volatility investing. Low volatility strategies are designed to reduce exposure to stocks with high price variability and often avoid the largest, most volatile names that dominate market-cap indices. Rather than chasing performance, low volatility portfolios aim to manage risk more deliberately, seeking smoother returns over full market cycles.
The advantages of this approach become more visible during market stress. For example, during the trade-related market sell-offs of April 2025, high-beta stocks, especially those in the tech sector, led the declines. In contrast, lower volatility strategies, such as the TD Q U.S. Low Volatility ETF, remained relatively stable, offering a buffer against shocks. (As of June 30, 2025, the TD Q U.S. Low Volatility ETF - whose inception date is May 26, 2020 - has posted a one-year return of 12.26 %, a three-year return of 8.03% and a five-year return of 9.21%.)
Figure 4: Capital Drawdown
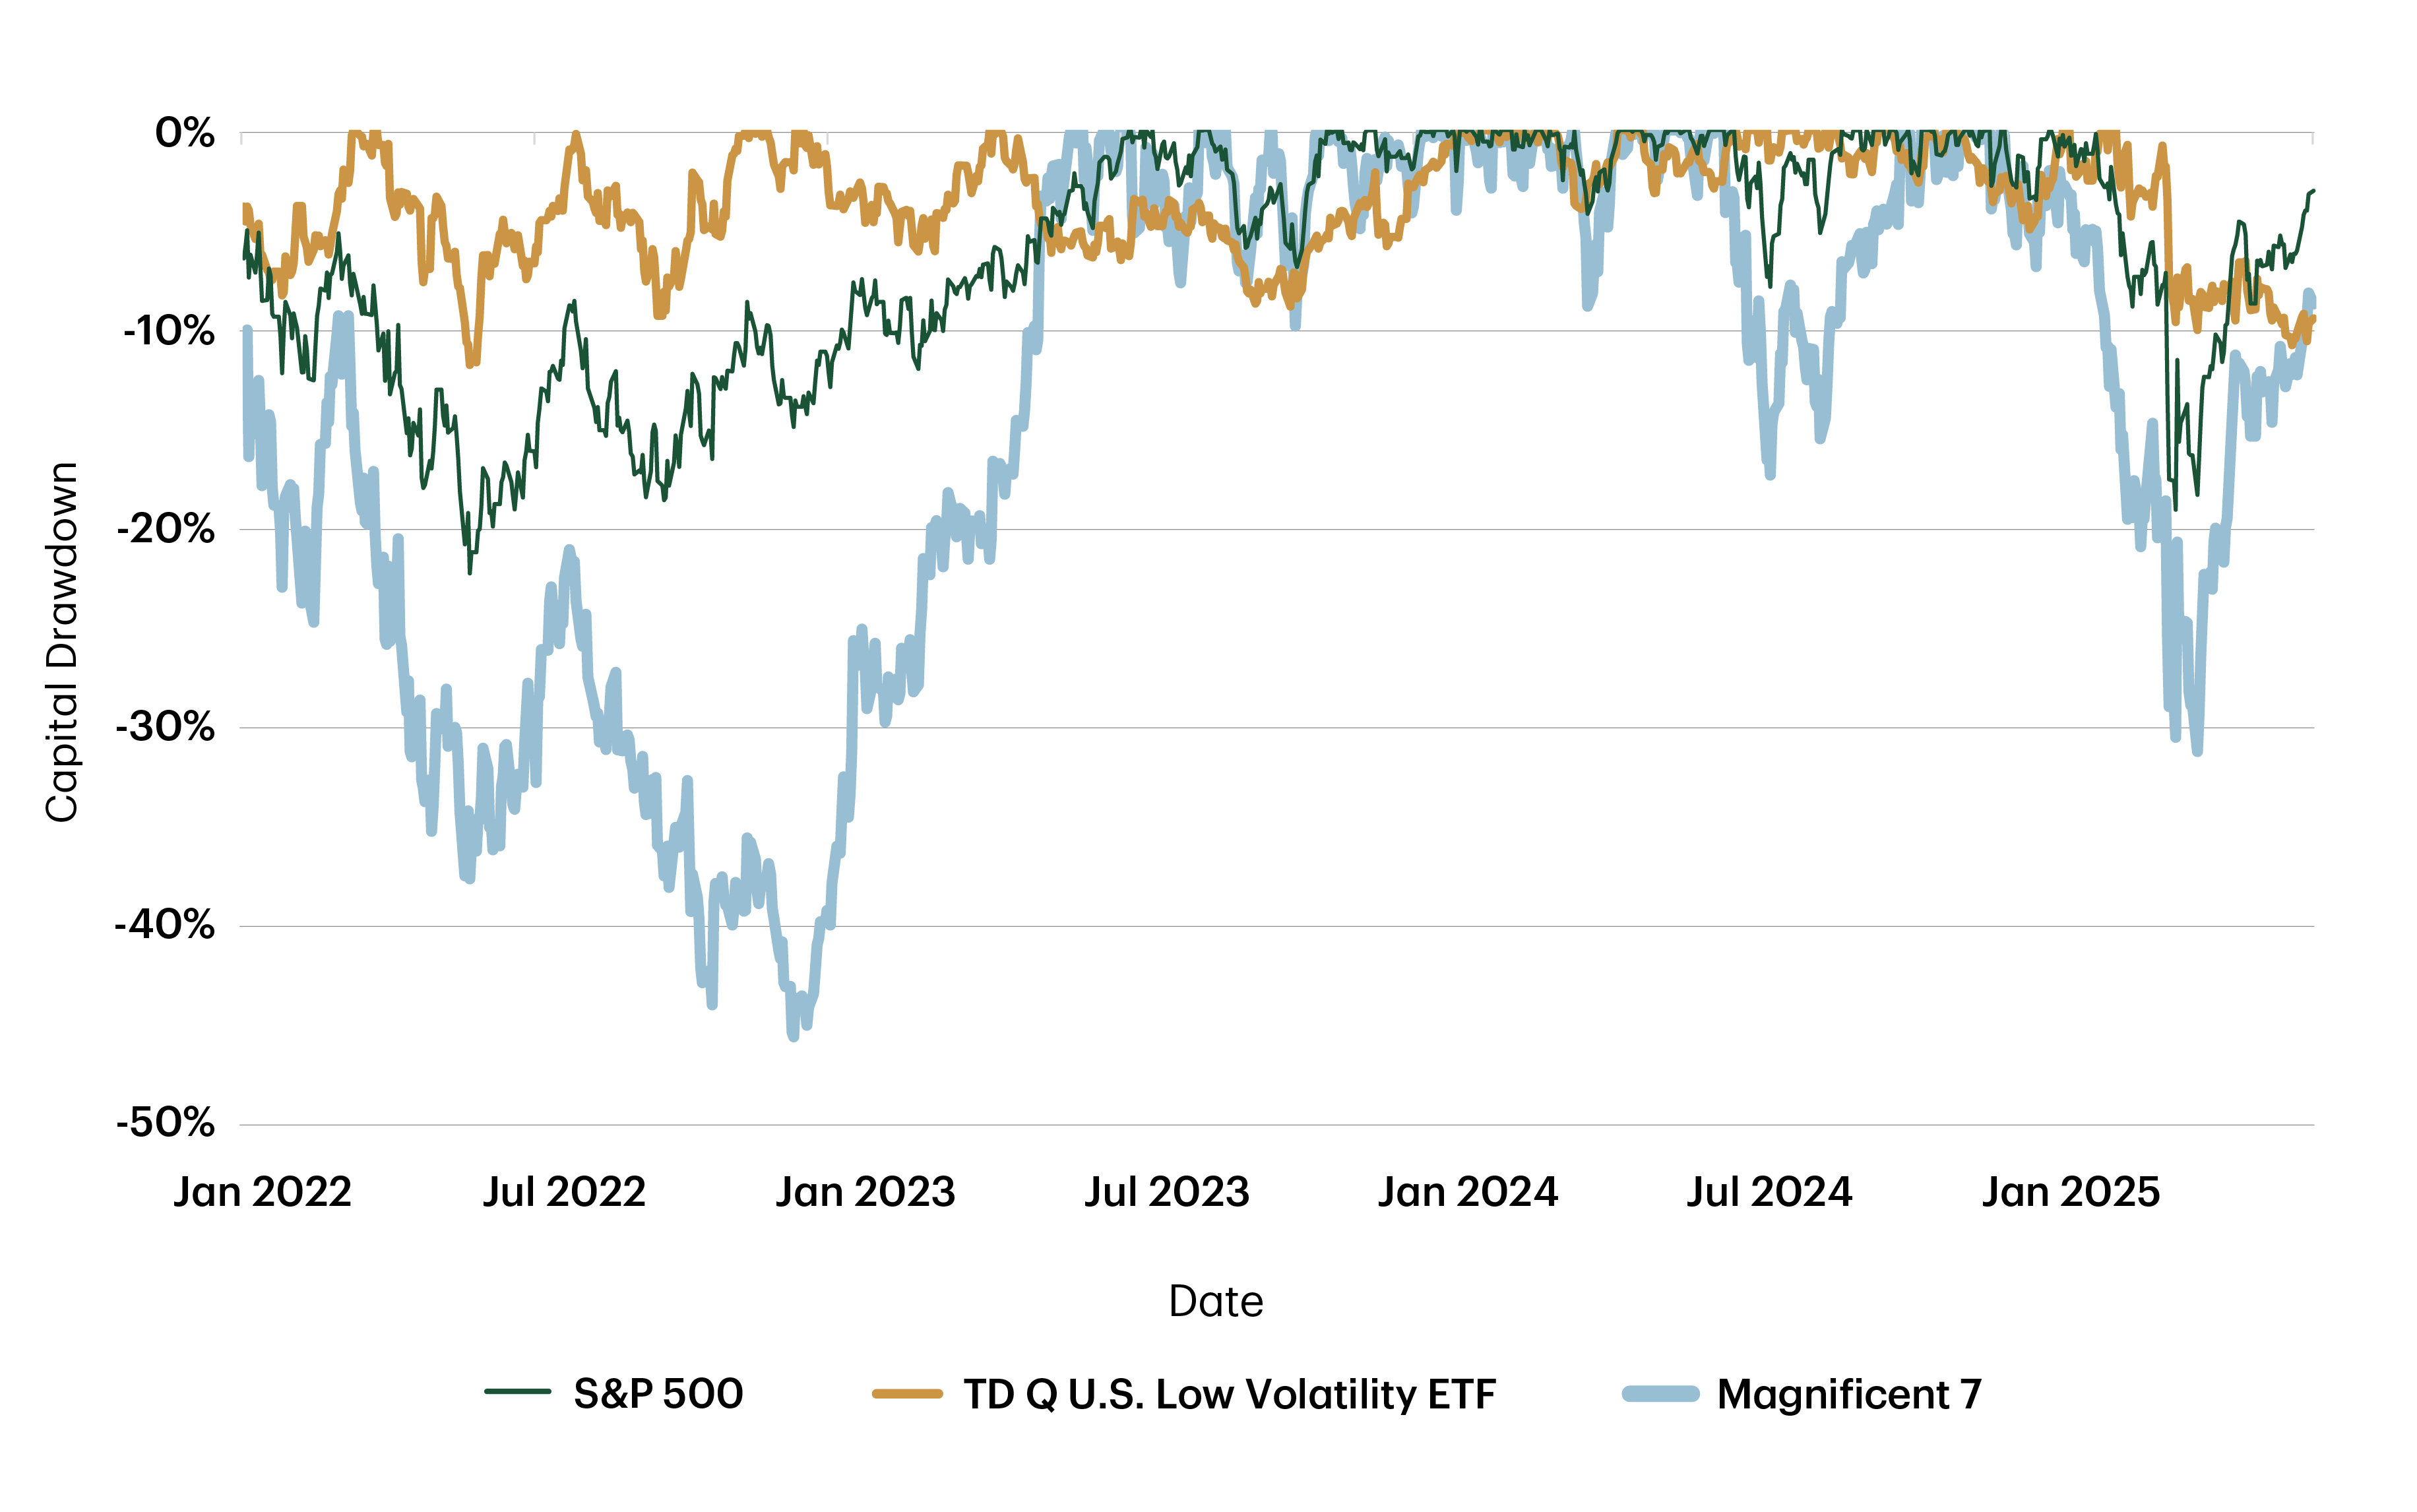
Source: TDAM, Bloomberg Finance L.P. As of June 30, 2025.
Diversification As a Safeguard
Market-cap-weighted indices have generally provided stronger than normal returns over the past decade, especially against the backdrop of low interest rates, ample liquidity and consistent outperformance of tech stocks. But investors should ask themselves whether those conditions will continue indefinitely. Are they prepared for what comes next if the same 10 names can't carry the market into the next decade?
It's difficult to imagine a sustainable future where just a handful of stocks represent one-third of the entire S&P 500. If history is any guide, such extreme concentration rarely ends without a shakeout. For long-term investors, diversification is a safeguard. Low volatility portfolios may be one of the few strategies positioned to help navigate the fallout of an increasingly imbalanced market.
信息披露
本文所含信息由道明资产管理有限公司提供,仅供参考。信息出自我们认为可靠的来源。图表仅供解说之用,并不反映任何投资的未来价值或未来表现。本信息并未提供财务、法律、税务或投资建议。具体的投资、税款或交易策略应根据每位投资者的目标和风险承受能力加以评估。
进行交易所买卖基金投资可能需要负担相关佣金、管理费以及支出。投资前请参阅招股章程和ETF情况概要。交易所买卖基金没有担保,其价值可能经常变化,且既往表现可能不会重现。交易所买卖基金单位在证券交易所按市场价格进行买卖,因此收益会因经纪人佣金的支付而减少。指数回报不代表道明交易所买卖基金的回报。所显示的回报率为所示期限的历史总回报率,包括单位价值变动和所有分红再投资,并未考虑任何单位持有人的赎回、佣金或所得税,这些部分会降低回报。过往表现未必会重现。
本文档中的部分陈述可能包含预测性的前瞻性陈述(“FLS”),其中包含“预计”、“预期”、“打算”、“认为”、“估计”和类似的前瞻性表述或其否定形式。前瞻性陈述基于当前对未来普遍的经济、政治、相关市场因素(例如利率和汇率、股票和资本市场)以及普遍经营环境的预计和预测,并假定不发生税法或其他法律或政府管制方面的任何变动或灾难事件。对于未来事件的预计和预测本身受无法预见的风险和不确定性的影响。此等预计和预测可能在未来并不准确。前瞻性陈述并非对未来表现的保证。实际发生的事件可能与前瞻性陈述明示或暗示的事件存在实质差异。包括上文所述各项因素在内的多个重要因素均可能造成这种背离。您不应在任何程度上依赖于前瞻性陈述。
所引用的各项指数是被广泛认可的投资基准,代表非由管理人管理的投资组合。无法直接投资于指数。关于指数的信息使得可以将投资策略的结果与广泛认可的市场指数进行比较。指数的表现不考虑交易佣金和费用。指数波动性可能与策略的波动性存在显著差异,而且投资组合的持仓可能与构成指数的证券存在显著差异。
Bloomberg和Bloomberg.com为Bloomberg Finance L.P.(特拉华州注册有限合伙企业)或其子公司的商标和服务标识。保留所有权利。
道明交易所买卖基金由道明银行(Toronto-Dominion Bank)全资子公司道明资产管理有限公司(TD Asset Management Inc.)管理。
® TD标志和其他TD商标为道明银行或其子公司的产权。