
@TDAM_Canada
Investor Knowledge + 5 Minutes = Current Insights
There is an often-ignored cognitive bias that needs to be addressed in today's investing environment. Recency bias is a tendency that causes people to think that because certain events happened recently, they are likely to reoccur in the future. Interestingly, this bias can be observed in the investment industry ranging from novice investors all the way to professionals.
For example, a do-it-yourself (DYI) investor may follow a recent hot trend with the expectation that it will continue. This bias can also work against investment professionals when analyzing recent data to make investment decisions and not "widening the lens" to consider data from longer times frames. Today, this bias can be seen when looking at inflation within the current economic environment
Looking back…way back
Over the past two decades, prior to the Covid-19 Pandemic, there really wasn't much need to seek additional sources of diversification within the traditional 60% equities and 40% bonds (60/40) portfolio. A 60/40 portfolio historically worked well in delivering attractive risk-adjusted returns ¹. Bonds buffered the portfolio if equities didn't perform well due to a very important phenomenon - a strong negative correlation between equities and bonds (the increase in value of one is associated with the decrease in value of the other) ².
While this worked well for nearly two decades, does this mean it will continue over the next two decades or should we consider if we have been taking this negative correlation for granted? History tells us that this negative correlation holds if inflation remains under 2%³. But perhaps the question investors should be asking is how often does inflation average above 2%?
The surprising answer is most of the time - depending on how far back you look.
Historically speaking, up until 2020, the prior two decades were an anomaly. Over the last 100 years we have spent most of the time in environments where inflation was above 2%, and where bonds and equities were positively correlated⁴. In fact, we've spent roughly 60 of the last 100 years, including the last four, just such an environment.
The "new" need for added portfolio diversification
As we spend more time in an environment that resembles the historical "norm", there is an increased focus on the need for additional diversification. While we feel stocks and bonds remain the bedrock of a diversified portfolio, commodities are interesting for their low to negative correlation with both bonds and equities over the last 50 years, and more importantly over the last five years⁵. Because of this negative correlation, adding commodities to a portfolio can potentially result in better risk adjusted returns.
As we look ahead, there are other dynamics at play that need to be considered. The volatility of inflation is clearly higher in the current era than it was in the prior two decades. We live in a world of elevated geopolitical risk and uncertainty which has been driving countries to become more economically independent through near shoring/friend shoring/reshoring. This trend is inflationary as the world builds parallel supply chains and loses economies of scale. Against this backdrop, concerns of low growth are coming to the forefront as the increasing uncertainty rising from the unpredictability of U.S policy could result in a contraction of business activity. For the first time in several decades there is a real possibility of an economy with stagflation (a combination of high inflation, stagnant economic growth, and elevated unemployment).
Portfolio considerations with stagflation in mind
Asset classes perform differently during different economic periods. As seen in the charts below, using different combinations of high/low economic growth and high/low inflation helps illustrate the different returns for equities, bonds and commodities during different macro-economic environments.
Asset Class Returns in Different Macro Environments
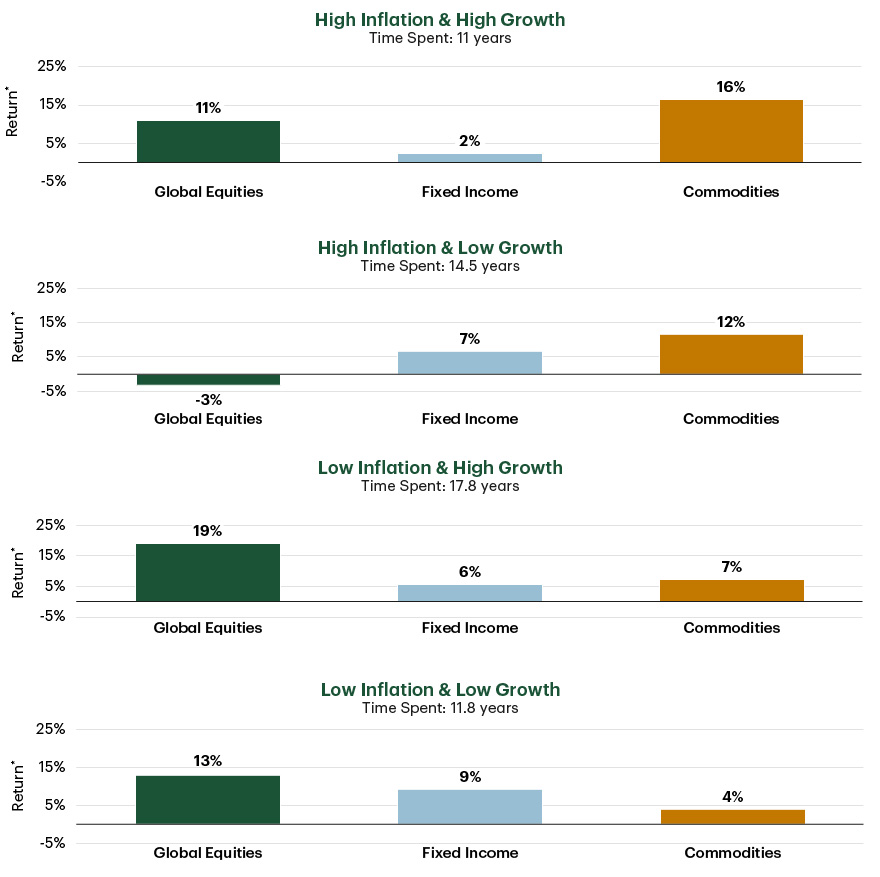
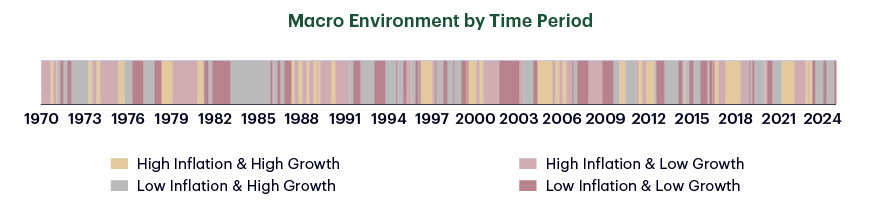
1 3-month return, annualized. Note: For illustrative purposes only. Data from January 1970 to December 2024. High Growth = Monthly GDP greater than trailing 5-year GDP average. Low Growth = Monthly GDP lower than trailing 5-year GDP average. High Inflation = Trailing 3-month average CPI greater than trailing 3-year average CPI. Low Inflation = Trailing 3-month average CPI less than trailing 3-year average CPI. Global Equities = NDDUWI Index. Fixed Income = LUATTRUU Index. Commodities= BCOMTR Index. Source: Bloomberg Finance L.P. As of Dec 31, 2024.
There is no surprise that commodities perform well in high growth and high inflation environments. What may surprise some is that commodities tend to be the best performing asset in the stagflation quadrant, when growth is low, but inflation is high. What's also important to note is that although fixed Income appears to have provided reasonable returns during periods of stagflation, these previous periods were when nominal yields were over 10% during a period in the 1980s. Considering the starting point of yields today, it would be highly unlikely that fixed income would be able to return 7% if the economy fell into a period of stagflation.
Mitigating equity pullbacks
The diversifying benefits of commodities also include helping to mitigate equity pullbacks. As seen in the chart below, over the last 50 years, roughly 2/3rds of the time a portfolio with a 10% allocation to commodities had a lower pullback versus a portfolio without. It is also worth highlighting that the 1/3rd of the time in which commodities didn't help was predominantly in the decade prior to the Covid-19 Pandemic. A decade in which commodities were in a bear cycle and an era characterized by low growth, low interest rates, and low inflation. This is unlikely in the decade ahead as it looks like we are in the early innings of a commodity supercycle.
Including Commodities Can Help Lower Max Drawdowns
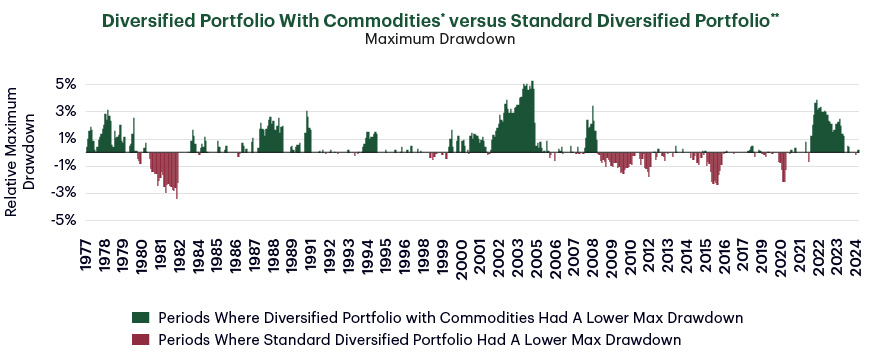
1 Monthly Data from 1977 to 2024. 2 Diversified Portfolio With Commodities: 54% MSCI USA Index, 36% Bloomberg U.S. Aggregate Bond Index, 10% BCOM Total Return Index. 3 Standard Diversified Portfolio: 60% MSCI USA Index, 40% Bloomberg U.S. Aggregate Bond Index. Source: TD Asset Management Inc., Bloomberg Finance L.P. As of December 31, 2024.
As the world seemingly becomes more disorderly economically, it is less certain what it will look like over the next few years. In an uncertain investing environment, a more diversified portfolio that is less vulnerable to inflation is key to help ensure investors stay on track to reach their goals. Commodities may be a key ingredient in building such a portfolio.
¹ Source: Measures an investment's return after considering the degree of risk taken to achieve it.
² Source: SBBI via CFA Institute. As of May 31, 2024.
³ Source: Bloomberg Finance L.P., TD Asset Management Inc. Data as of Sep.30, 2024.
⁴ Source: Bloomberg Finance L.P., CPI Year-over-year Index. Data as of Dec. 31, 2024.
⁵ Source: Bloomberg Finance L.P. Data as of April 30, 2024.
本文所含信息由道明资产管理有限公司提供,仅供参考。信息出自我们认为可靠的来源。本信息并未提供财务、法律、税务或投资建议。具体的投资、税款或交易策略应根据每位投资者的目标和风险承受能力加以评估。图表仅供解说之用,并不反映任何投资的未来价值或未来表现。
本文档中的部分陈述可能包含预测性的前瞻性陈述(“FLS”),其中包含“预计”、“预期”、“打算”、“认为”、“估计”和类似的前瞻性表述或其否定形式。前瞻性陈述基于当前对未来普遍的经济、政治、相关市场因素(例如利率和汇率、股票和资本市场)以及普遍经营环境的预计和预测,并假定不发生税法或其他法律或政府管制方面的任何变动或灾难事件。对于未来事件的预计和预测本身受无法预见的风险和不确定性的影响。此等预计和预测可能在未来并不准确。前瞻性陈述并非对未来表现的保证。实际发生的事件可能与前瞻性陈述明示或暗示的事件存在实质差异。包括上文所述各项因素在内的多个重要因素均可能造成这种背离。您不应在任何程度上依赖于前瞻性陈述。
指数收益数据仅用于比较用途。指数无人管理,其回报包括股利的再投资(若适用),但未计入任何销售费用或其他费用,因为这些费用会降低绩效。无法直接投资于指数。
Bloomberg和Bloomberg.com为Bloomberg Finance L.P.(特拉华州注册有限合伙企业)或其子公司的商标和服务标识。保留所有权利。
道明资产管理有限公司 (TD Asset Management Inc.) 是道明银行 (The Toronto-Dominion Bank) 的全资拥有附属机构。
® TD标志和其他TD商标为道明银行或其子公司的产权。